Sales Productivity Metrics That Connect Rep Activity to Pipeline
Track which activities actually move deals forward, not just whether reps stay busy.
- Written by
- Dayo Fashola
- Published
- October 3, 2026
- Reading time
- 11 min read
- Sources cited
- 5 sources ↓
What this covers
The CRM is full. Slack is busy. Calendars show back-to-back meetings all week, and the dashboard says activity is up across the board. Revenue still hasn't moved. That disconnect is the starting point for this piece: most sales productivity systems track what reps do rather than what their actions produce, and the two are not the same thing.
The gap has a structural cause. Salesforce's State of Sales Report found that reps spend only about a third of the week on selling itself. The rest goes to admin work, internal meetings, and data entry. Most measurement systems don't account for that split. They count calls and emails and meetings booked inside whatever selling time remains, but they never ask what that volume did. A rep who sends 100 generic emails and books one meeting looks exactly as busy on the activity dashboard as a rep who sends 50 targeted emails and books five. Both are "active" by the only definition most systems use.
CSO Insights research backs this up from a different angle: reps spend only a minority of their time on direct revenue-generating work. Pushing for more activity inside a system that already wastes most of the selling week doesn't fix the underlying waste. It scales it. A manager who sees a rep missing targets and responds by demanding more calls, more emails, more touches is applying more of the same input to a process that has already shown that input isn't the bottleneck.
The fix starts with a different question. Instead of asking whether reps are active, a manager needs to ask which activities consistently create pipeline movement. That question sounds small, but it reorganizes the entire measurement problem. It stops treating effort as a proxy for progress and starts asking for evidence that the effort did something downstream. The rest of this piece builds the framework that answers it.
The activity-pipeline-outcome stack
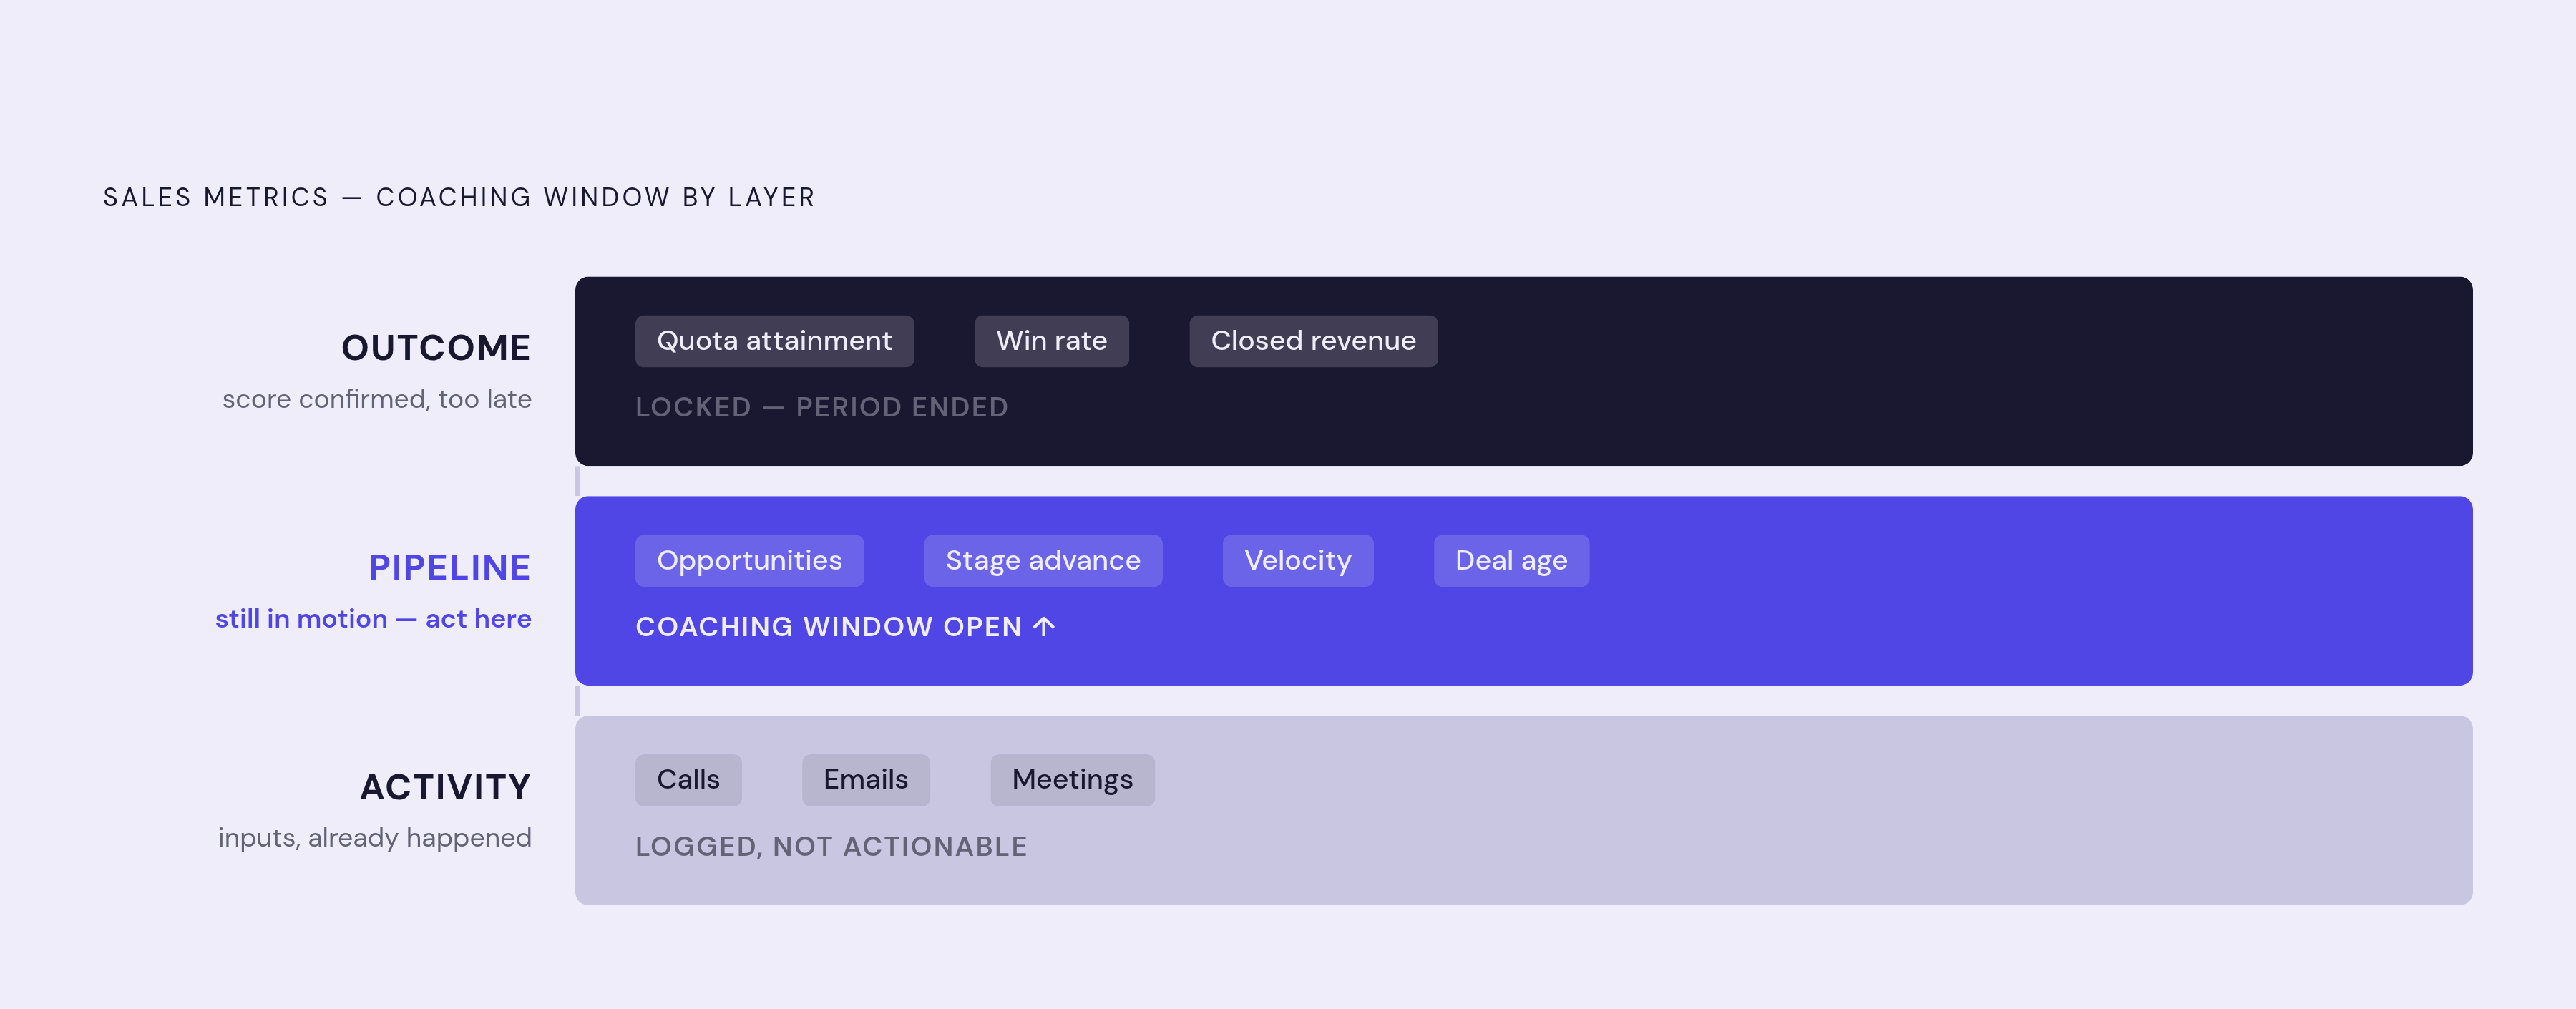
Every sales metric measures one of three things: effort, motion, or result. Those three categories stack in a specific order, from activity at the bottom to outcome at the top, and the order matters because of how useful each layer is after the fact.
The activity layer covers calls placed, emails sent, meetings booked, demos delivered, and lead response time. These are inputs. They show what a rep is doing, but they don't say whether the doing is working. High activity paired with low conversion is a signal pointing somewhere else, usually at message quality or how deals get qualified in the first place.
The outcome layer sits at the top: quota attainment, win rate, closed revenue, revenue per rep. These numbers confirm what happened, but they arrive after the period is already over, and they carry contamination from territory and market conditions that makes it hard to isolate what any individual rep actually did. A manager looking only at outcome metrics knows the score. Knowing the score doesn't tell anyone what to coach.
Between those two sits the pipeline layer: opportunities created, stage advancement, pipeline velocity, deal age. This layer sits between cause and effect, and it's the only one of the three where a manager can still act while the outcome is still being decided. Activity has already happened by the time it's logged. Outcomes are locked in by the time they're reported. Pipeline metrics describe something still in motion. A manager who sees pipeline velocity slowing or deal age stretching has time to intervene before the quarter closes.
That distinction sets the rule for how to use each layer: outcome metrics judge the score, while activity and pipeline metrics are what a manager actually changes. The coaching window closes once a number reaches the outcome layer. Everything useful happens before that, in the middle layer that most productivity systems underuse.
The four pillars that turn the stack into a diagnostic system
The three-layer stack gives managers a mental model. Turning that model into something usable day to day means organizing metrics into four pillars: activity, efficiency, effectiveness, and outcome. The value of this structure isn't that it adds more things to track. It narrows what gets managed by showing which pillar is actually broken before a manager picks a fix.
| Pillar | Core question | Example metrics | What it exposes | |---|---|---|---| | Activity | Did the rep do enough? | Calls made, emails sent, meetings booked, follow-ups completed, opportunities touched | Useful only paired with a conversion or quality metric; alone, these become vanity dashboards. Low output here often starts with inconsistent coverage or poor time allocation, not laziness. | | Efficiency | Did the process waste effort? | Activities per opportunity created, meetings per opportunity, time spent on admin versus selling | When a rep needs too many touches to produce basic movement, the cause is usually weak targeting, tool friction, or unclear stage definitions, not rep skill. Efficiency metrics expose system drag. | | Effectiveness | Did the effort convert? | Win rate, stage-to-stage conversion, meeting-to-opportunity conversion, qualification quality, forecast accuracy | Stamina's 2026 SMB guide identifies this as the pillar to trust most when a team looks active but underperforms. A rep with lower activity and stronger conversion is often healthier than one with high volume and weak progression. | | Outcome | Did revenue move? | Closed revenue, quota attainment, pipeline contribution, average cycle health | Lagging by nature. Useful for judging the score, not for triggering coaching, since by the time these numbers move, the root cause is already weeks old. |
You get the diagnostic power by reading across pillars instead of fixating on one. If a rep has high activity, low efficiency, and low effectiveness, the problem is targeting or qualification, because plenty of effort is going in without the process converting it. A rep with strong efficiency and effectiveness but weak outcomes may simply have a territory or deal-size problem that no amount of individual coaching will fix. The four pillars separate those two reps, who would look identical on an outcome-only dashboard, and point to two entirely different interventions.
The metrics that genuinely connect rep behavior to pipeline movement
A metric earns a place in this framework only if a change in it reliably traces back to a change in the rep's own behavior, not to the rep's territory or market conditions. That's the test each of the following metrics has to pass.
Pipeline created per rep is the strongest single leading signal, because a rep builds it through prospecting and qualification rather than inheriting it from deal flow already in motion. It has a trap, though: raw pipeline value inflated by low-fit accounts drags down win rate and burns capacity later, so a surge in pipeline from poor-fit accounts is worse than no surge. SalesScreen's 2026 guide lists pipeline created per rep among five metrics that consistently isolate the rep from the territory, alongside stage conversion rates, selling-time ratio, follow-up speed, and quota attainment read alongside the others rather than alone.
Stage conversion rates show how well a rep moves deals from one defined stage to the next, and that isolates selling skill from lead quality better than almost any other metric available. A rep with a strong lead-to-meeting rate but a weak meeting-to-proposal rate has a specific, coachable gap, because the conversion data points directly at where in the funnel the breakdown happens. So benchmark a rep against their own trend and against role peers, not a single universal number, because the conversion rates that matter shift by motion and by deal type.
Lead response time offers one of the most direct activity-to-pipeline links available. Research cited by Heimdall, referencing Harvard Business Review, found that sales teams are nearly seven times more likely to qualify a lead if they respond within one hour than if they wait even one more hour, and the odds get far worse if a team waits a full day or longer. Gong Labs research also found that reps who reply within 24 hours get win rates 14% higher and sales cycles 11% shorter than reps who don't. Response time sits entirely within a rep's behavioral control, which makes it one of the cleanest coaching targets in the entire stack.
Selling-time ratio measures the share of a rep's week actually spent in front of buyers, and it counts as a productivity metric in the purest sense, because capacity lost to admin work never appears in the pipeline. Bain & Company research cited by SalesScreen found sellers spend only about a quarter of their week actually selling, with the rest lost to admin, research, and tool-switching. A dropping selling-time ratio is an early warning sign: capacity is eroding before pipeline numbers ever reflect it.
Meeting-to-opportunity conversion rate matters most for SDR teams, where what counts comes after a real conversation, not raw dial volume. Connect rate, qualified meetings booked, meeting-held rate, and opportunity conversion tell a manager whether outreach is producing anything, where dials and emails sent are inputs worth monitoring but not outcomes worth managing toward.
Pipeline velocity as the single metric that surfaces deal creep before it kills a quarter
A rep can hit every activity target on the board and still produce a fraction of the revenue the pipeline suggests, because deals often just move slowly instead of stalling. That slow drift is deal creep, and pipeline velocity is the metric built to surface it before it turns into a missed quarter.
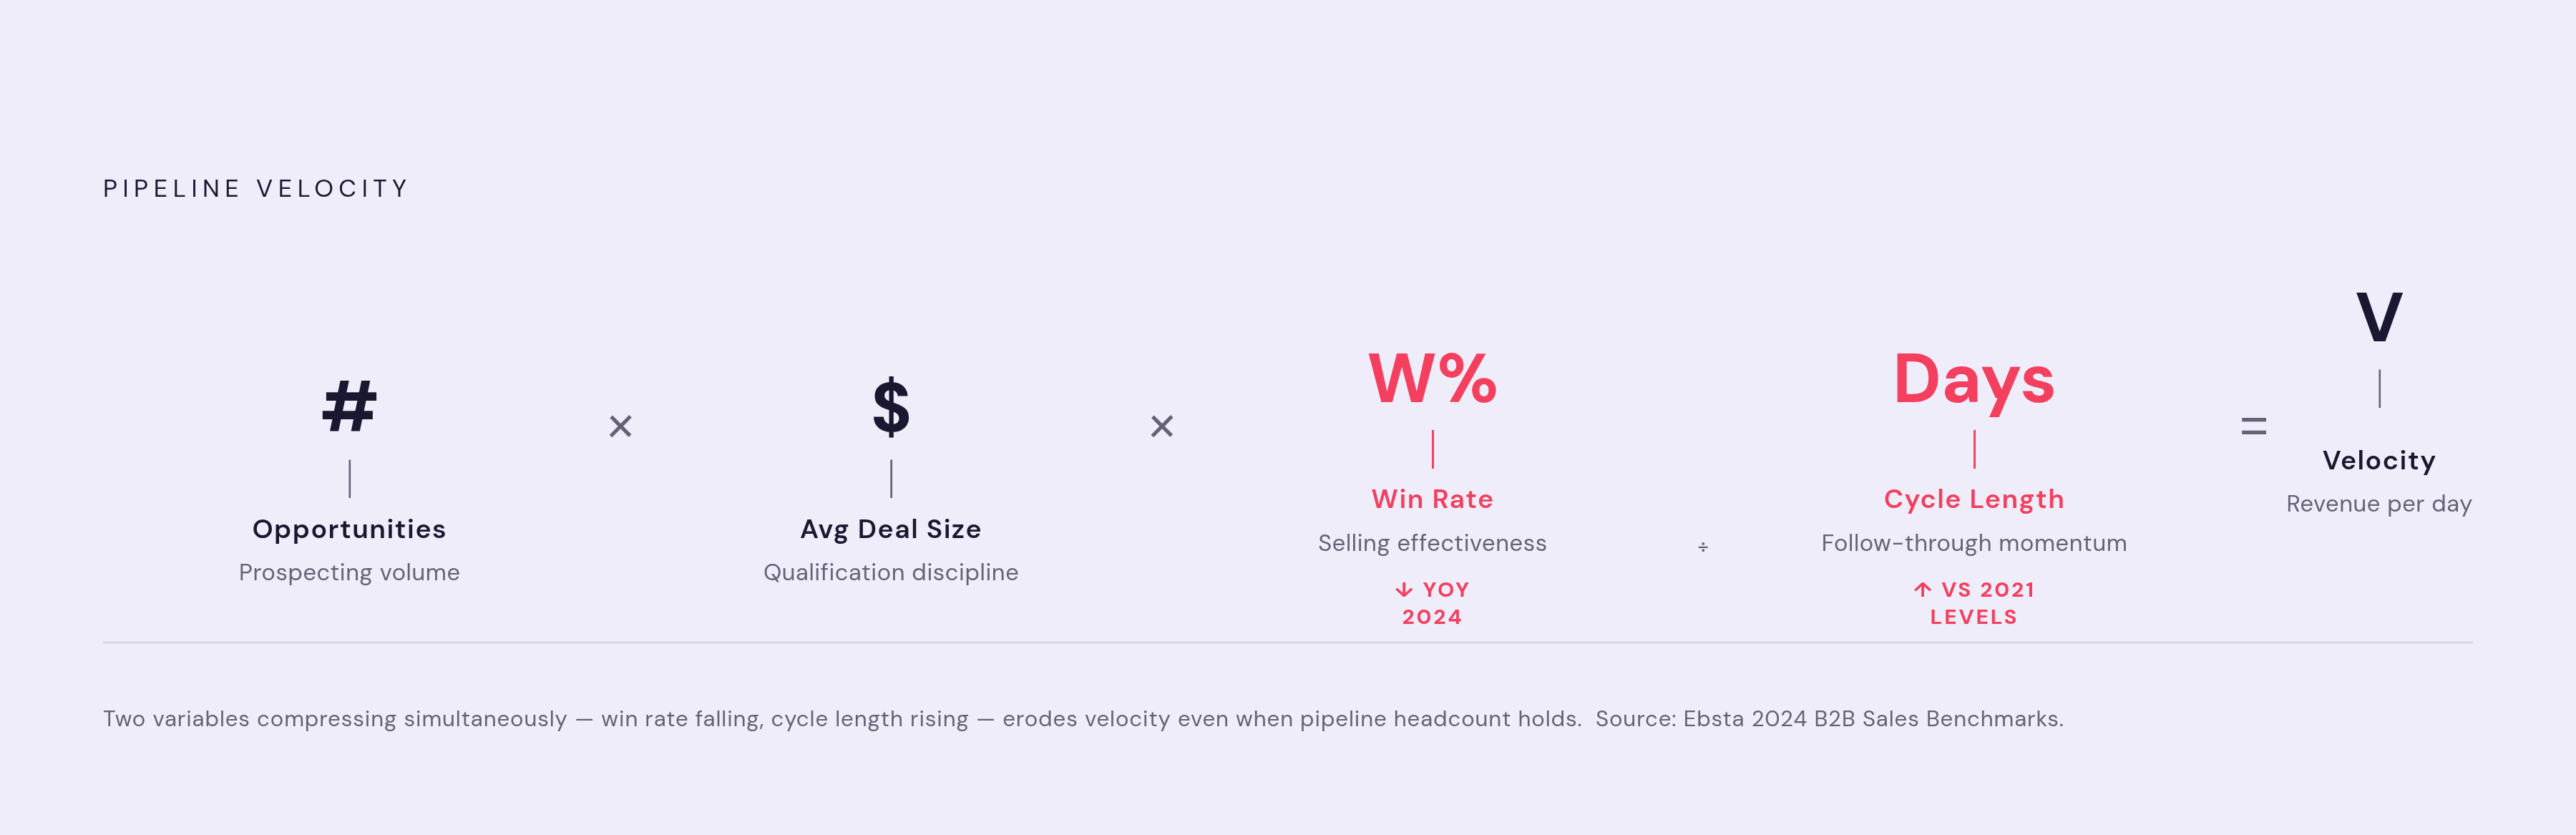
The formula is: (Number of Opportunities × Average Deal Size × Win Rate) ÷ Sales Cycle Length in days. Each variable maps to a specific rep behavior. Opportunity count reflects how much prospecting the rep is doing. Deal size reflects qualification discipline and how well the rep expands within accounts. Win rate reflects selling effectiveness once a deal is in motion. Cycle length reflects momentum, how consistently a rep follows through and keeps a deal from sitting idle at a given stage. Because each variable ties to a distinct behavior, a drop in velocity can be traced back to whichever one moved, making the metric diagnostic rather than just descriptive.
Current market conditions make this formula especially sensitive. Ebsta's 2024 B2B Sales Benchmarks, cited by Mindtickle, found that win rates fell year over year while sales cycles stretched meaningfully longer than they were in 2021. Both of those variables sit in the velocity formula, and both were compressing it at the same time. Velocity is reacting to two simultaneous headwinds rather than one.
Velocity also exposes a trade-off that raw pipeline counts hide entirely: a surge in pipeline from low-fit accounts raises opportunity count while lowering win rate and extending cycle length. Raw pipeline headcount goes up. Velocity goes down. That contradiction is the quality issue a pipeline-count dashboard alone cannot show.
The majority of their deals were dying between the demo stage and the proposal stage, a handoff point that looked fine on an activity dashboard because reps were still delivering demos on schedule. Once the team diagnosed the handoff itself as the point of failure and rebuilt the process around it, the sales cycle shortened significantly. The lesson generalizes: velocity doesn't just report that a problem exists. It locates the stage where the problem is happening.
Quota attainment is the wrong primary metric for coaching individual reps
Quota attainment confirms what the territory, the market, and the rep produced together in a single period. It cannot tell a manager which of those three factors did the producing, which is exactly the information coaching requires.
SalesScreen's 2026 analysis frames the problem with precision: the rep at the top of the closed-revenue leaderboard might be the best seller on the team, or might simply have inherited the best territory, the warmest account list, and a couple of deals that were already halfway closed before they ever touched them. The number alone doesn't distinguish between those explanations. So reading quota attainment on its own gets the read wrong both ways. Managers end up rewarding reps for landing in a good territory and blaming reps for landing in a weak one, learning nothing in either case about who is actually improving at the job.
The goal isn't to stop tracking quota attainment, but to stop treating it as the trigger for coaching conversations and start reading it alongside the leading indicators that came before it in the stack. If a rep misses quota but shows strong stage conversion and healthy pipeline creation, a territory or deal-size problem is more likely than a skill problem. But if a rep misses quota and also shows weak conversion, more pipeline volume won't fix that. The leading metrics are what separate those two cases. Quota attainment by itself cannot.
AI and signal-based targeting have decoupled activity volume from pipeline creation
AI tools have made high-volume outreach cheap to produce, and that shift has stripped most of the diagnostic value out of simple activity counts. The same number of emails sent now covers a range of effort running from near zero to substantial, depending on whether a human or a model wrote the message. A dashboard built to count emails sent has no way to tell which end of that range it's looking at.
The buyer side of the equation is shifting in the same direction. Everstage's 2026 analysis notes that B2B sales interactions now happen mostly in digital channels, so sales teams have to set goals around digital engagement quality, pipeline velocity, and pre-contact influence instead of meeting volume on its own. Buyers are doing more research and more qualification before a rep ever enters the conversation, so the activities that used to signal effort, the cold call, the first outreach email, now carry less information about what will actually move a deal forward.
Signal-based targeting sharpens the same point from the rep's side of the process. When reps can identify which accounts are showing real buying signals before reaching out, the entire premise behind counting raw activity volume breaks down further: fewer, better-targeted touches can produce more pipeline than a larger batch of generic ones, which is the exact contrast raised at the start of this piece between the rep sending 100 generic emails and the rep sending 50 targeted ones. Pipeline created per rep, stage conversion, response time, and selling-time ratio hold up because they measure what happens after the outreach, not the outreach itself. Those are the metrics built for an environment where activity is cheap and pipeline still has to be earned.
Methodology & sources
- Sales Productivity Metrics: Key KPIs for 2026
Provided the observation about B2B sales shifting to digital channels and the need to measure digital engagement quality and pipeline velocity over meeting volume.
- Sales Rep Productivity Metrics: A Guide for SMBs in 2026 - My Framer Site
Cited as identifying effectiveness as the pillar to trust most when a team looks active but underperforms, and referenced in the quota attainment section.
- What Are Sales Metrics? 20+ KPIs to Track in 2026
Cited for Ebsta's 2024 B2B Sales Benchmarks data showing win rates falling and sales cycles stretching longer than in 2021.
- Sales Productivity Metrics That Actually Reflect Performance
Cited for its list of five metrics that isolate rep performance from territory, and for Bain research on sellers spending only about a quarter of their week selling.
- Sales Productivity in 2026: Metrics, Strategies, and Tools
Cited for the Harvard Business Review finding that sales teams are nearly seven times more likely to qualify a lead when responding within one hour.