Pipeline Coverage Ratios and Forecasting Accuracy for RevOps
Coverage targets should come from your own win rates, not a 3x rule.

- Written by
- Mirela Ostrowski
- Published
- November 13, 2026
- Reading time
- 8 min read
- Sources cited
- 2 sources ↓
What this covers
Pipeline coverage ratios and forecasting accuracy depend on the same assumption, namely how much qualified pipeline will become revenue. For revenue operations teams, a coverage multiple derived from actual win rates and adjusted for timing replaces a universal 3x target. As B2B conversion has weakened, conventional targets have understated pipeline requirements, while nominal coverage has concealed the gap.
Why the 3x pipeline coverage rule has no factual foundation
A revenue operations leader reports coverage as “green” while the quarter is already short. Even with correct calculations, the dashboard can compare pipeline with a target whose underlying conversion assumption no longer fits the business. That distinction explains how an apparently healthy ratio can coexist with an impending miss. The error is in the benchmark.
The 3x rule is a Goldilocks convention. It encodes a roughly one-in-three win rate without establishing that this conversion rate applies to the pipeline being measured. Sales managers passed the rule down by word of mouth in enterprise software businesses in the 1990s, before pipeline software existed. Its familiarity gave it authority that its arithmetic had not earned.
Dave Kellogg, who ran MarkLogic and Host Analytics and has written about pipeline math for over a decade, noted in 2013 that he did not know the rule’s history. He characterized its apparent reasoning as Goldilocks. That leaves no empirical foundation for treating it as a universal operating target. Without a stated win rate assumption, a coverage threshold can stay the same even as more pipeline is needed to reach quota.
What the coverage formula actually encodes, and why win rate is the only variable that matters
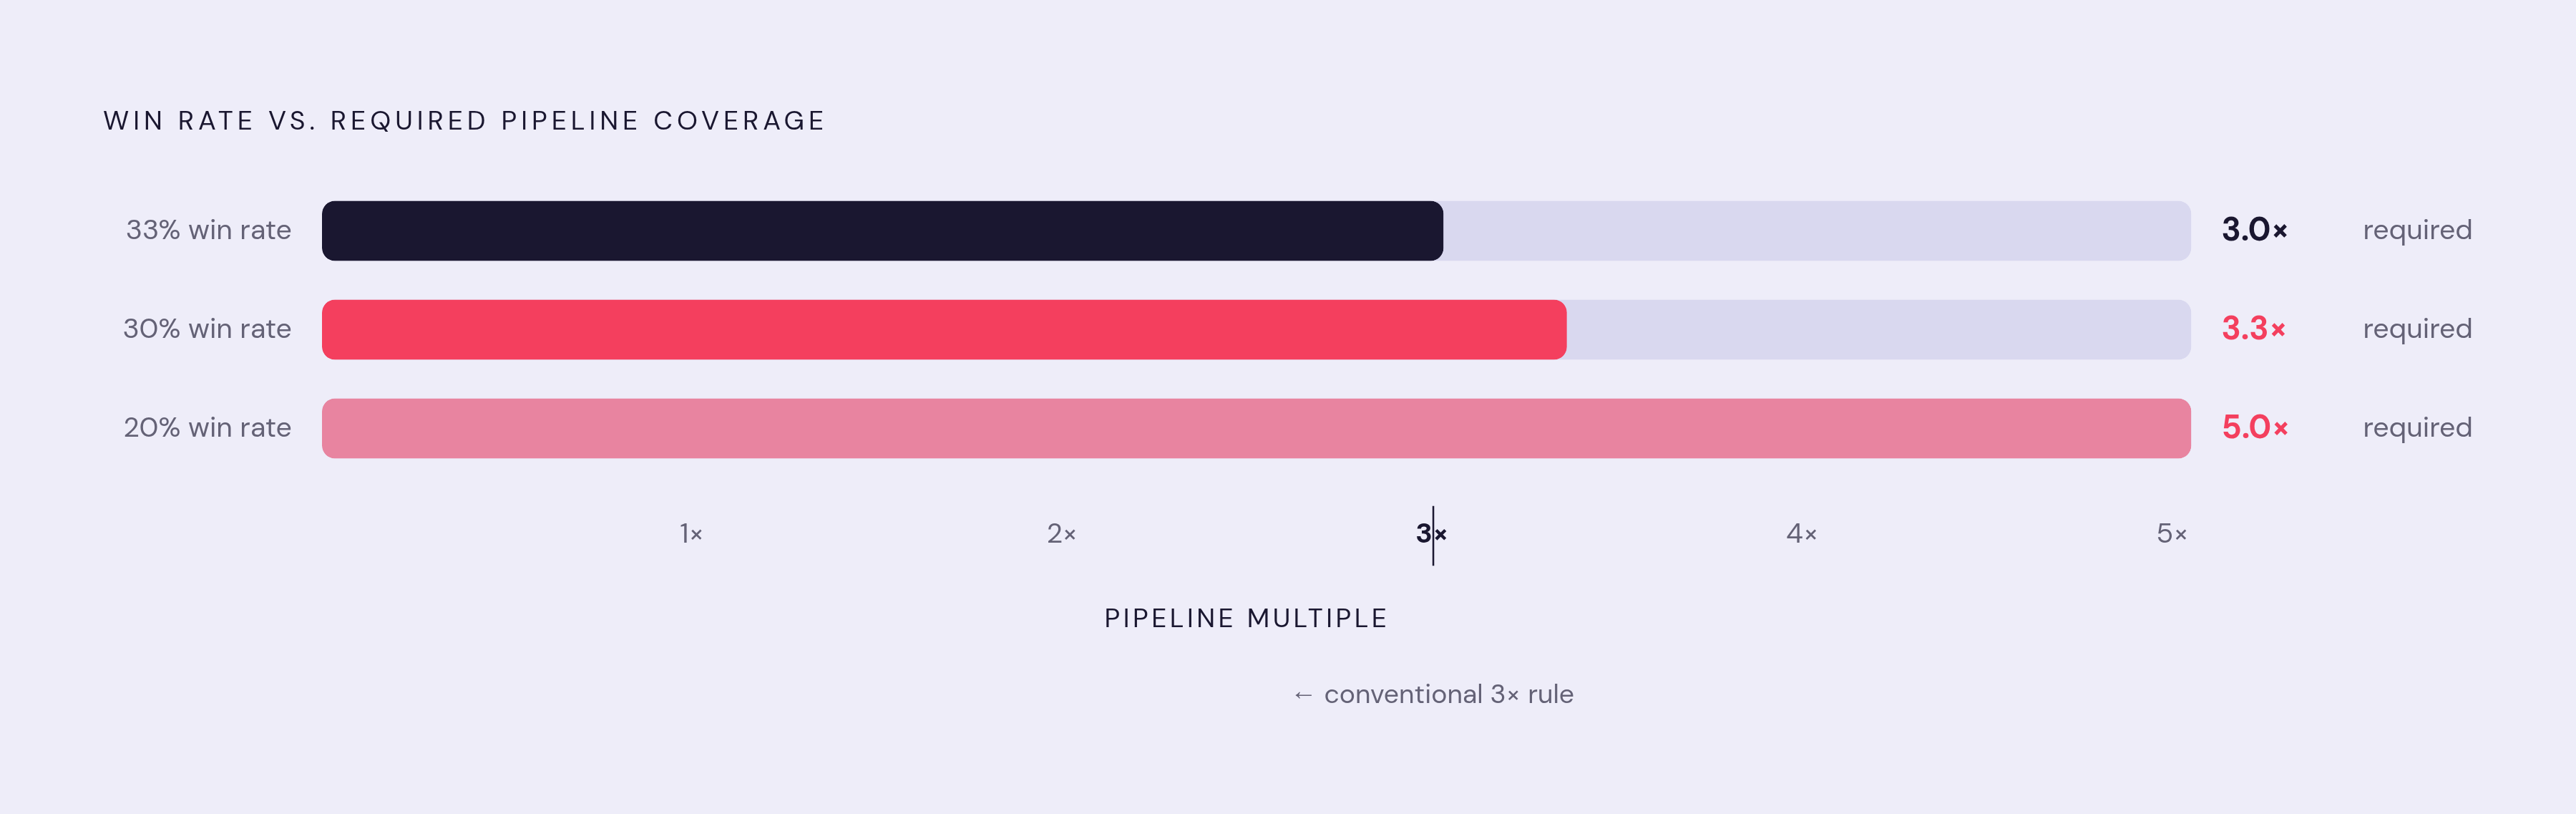
Observed pipeline coverage is the total value of qualified pipeline divided by the quota target. Required coverage answers a different question, namely how much pipeline is needed to produce that quota at a given win rate. In its simplest form, the required multiple equals one divided by historical win rate. Multiplying pipeline by the conversion assumption gives the revenue it is expected to produce. The target follows directly from that relationship.
As conversion falls, the required multiple rises, even if quota stays the same. Slippage and the share of pipeline that closes within the planned period refine the calculation further, but they do not replace its underlying logic. A ratio of 3x has no independent meaning. Its adequacy depends on whether the business converts enough of that pipeline into revenue.
The numerator must contain only qualified opportunities. For qualification, an opportunity must have buying intent on record, a known need, a timeline, and stakeholders who are actively involved. Win rate must begin at a corresponding qualification gate, where sales accepts an opportunity with a confirmed problem and timeline. Otherwise, the measures describe different populations. Unqualified records inflate apparent coverage, while ghost deals in the win rate denominator depress measured conversion and inflate the calculated requirement.
This consistency is essential to interpretation. A team cannot use a win rate based on sales-accepted opportunities to back a coverage figure padded with early records logged for activity metrics. Only with that consistency can the inverse relationship give teams a baseline to plan from.
How far current B2B win rates have fallen from the assumption baked into 3x
Ebsta and Pavilion’s 2025 GTM Benchmarks show that B2B win rates are falling and that a large majority of sellers missed quota, with more quota misses than in the prior year. The conversion decline moves the operating environment away from the roughly one-in-three assumption embedded in 3x. The quota result aligns with that pressure but does not, by itself, isolate coverage calibration as the cause of missed targets.
The same report documents a significantly longer average B2B sales cycle than in 2019, although cycles shortened year-over-year compared with 2024. Those comparisons describe different time horizons and are not contradictory. The longer-term change adds a timing constraint to the conversion constraint. Pipeline created today may convert later than the quarter whose target it is supposed to support. Nominal coverage does not distinguish between those outcomes.
A hypothetical team with a 30% win rate illustrates the arithmetic without treating that rate as the market average. At 3x coverage, multiplying qualified pipeline by that win rate produces less than the quota target, even before timing slippage. The team is short on expected revenue. Any share of eventual wins that moves outside the planned quarter widens that shortfall.
The relevant comparison is between a team’s own measured conversion and the assumption embedded in its target. Larger buying committees, more cautious procurement, and buyers going silent mid-cycle can affect above-average performers as well.
Why high coverage numbers hide risk instead of eliminating it
A high ratio built from stale or poorly qualified opportunities can support a worse forecast than a lower ratio built from qualified, fast-moving deals. Volume and quality are different signals. When a coverage target rewards the former without testing the latter, a larger numerator can make the outlook less informative.
Coverage resting on two enterprise logos is more exposed to individual deal outcomes than the same coverage spread across forty mid-market deals. Both can display identically on a dashboard. Yet the loss or delay of one opportunity has a different effect on the quarter. The ratio describes total value.
Fullcast’s 2025 Benchmarks Report finds that high-ICP accounts represent only a minority of total pipeline for many organizations. A simple unweighted ratio treats those accounts the same way as lower-fit opportunities. Nor does it distinguish a high-fit late-stage deal from a low-fit early-stage lead of the same value. Their nominal contribution is identical. Their contribution to a credible forecast is not.
Stale deals further inflate the apparent buffer. Opportunities that remain in the same stage well beyond a reasonable multiple of the average sales cycle weaken the ratio’s predictive value. A rising coverage ratio paired with falling stage-to-stage velocity is therefore not straightforward evidence of improving health. It can indicate that opportunities are aging while remaining in the numerator. More volume does not resolve a conversion or timing problem merely by making the dashboard greener.
How to calculate a coverage target that reflects your actual conversion profile
A team should measure historical win rate from sales-accepted opportunities with a confirmed problem and timeline, then separate new-logo business from expansion, SMB from mid-market and enterprise, and inbound from outbound. These distinctions prevent a blended average from obscuring different conversion profiles. The team then plans for each segment. The same qualification standard must govern both its historical results and its current pipeline.
For a worked example, consider a hypothetical segment with a 30% historical win rate and most eventual wins closing in the planned quarter. The first step is to divide one by that win rate to establish its baseline qualified-pipeline requirement. This already produces a multiple above 3x. In a spreadsheet, the corresponding inputs are the segment’s quota, measured win rate, and qualified opportunity values. The example uses no industry benchmark as a substitute for the segment’s own conversion history.
The second step evaluates the current pipeline through stage weighting. Each opportunity’s value is multiplied by the historical close probability for its stage, and those weighted values are added together. A dollar in Stage 1 is not equivalent to a dollar in Stage 4. For the hypothetical segment, this calculation shows whether its particular mix of opportunities supports the outlook implied by its nominal total. The spreadsheet therefore needs the opportunity’s stage and the historical probability associated with that stage.
The third step accounts for timing. Required coverage equals one divided by the product of overall win rate and pipeline-to-close rate. To keep this adjustment distinct from win rate, the timing input must describe the share of eventual wins that closes within the planned period. For the example, dividing one by 30% multiplied by that timing share produces a requirement further above the conventional rule. Multiplying quota by the resulting multiple gives the required qualified-pipeline value.
These calculations serve related but different purposes. The win-rate-adjusted multiple establishes how much nominal qualified pipeline is required, while stage weighting estimates the contribution of the opportunities actually present. Using the overall win rate again on stage-weighted values would count conversion loss twice. The two views should therefore remain distinct in the spreadsheet, with timing made explicit.
Enterprise sales usually needs higher coverage than mid-market, which usually needs higher coverage than SMB. Separate views by segment, stage, and rep cohort make those differences visible. Updating them as conversion changes keeps the target tied to the operating conditions it is meant to describe.
How coverage ratio connects to forecast accuracy, and where the connection breaks
A calibrated coverage target improves forecasting by exposing a gap between available pipeline and the revenue it can reasonably produce. That gap becomes visible before the final forecast deteriorates. Forecast misses often form over the preceding six to eight weeks as deals slip, buyers go silent, and committed opportunities fail to close. A conventional threshold can conceal those developments if it continues to label insufficient pipeline as healthy.
Coverage becomes a leading indicator only under specific conditions. Its numerator must be qualified, its conversion assumption must be accurate, and its timing must match the forecast period. Even then, it cannot identify every risk. Stage-to-stage conversion, deal velocity, average deal size, and slippage show changes that an aggregate multiple can miss. Even when the coverage ratio stays the same, the pace at which its opportunities move forward can change.
Behavioral and conversational signals add information that CRM stages alone cannot provide. Product usage, call sentiment, email response patterns, and intent data can make forecasts more accurate than stage-only models can. Coverage tests whether there is enough pipeline under the stated assumptions. The added signals help show whether the opportunities now in the pipeline still support those assumptions.
There is also a limit to what better measurement can repair. Coverage and forecast accuracy reflect the GTM plan, quota design, territory balance, and capacity model that generate the pipeline. A carefully weighted ratio may describe the gap produced by a broken foundation more accurately while leaving the underlying plan unachievable. This is where the connection between precise calculation and reliable attainment breaks.
The operational response is a weekly review that leads to decisions. A segmented, stage-weighted, win-rate-calibrated view can support earlier pipeline generation, tighter qualification, removal of a deal from the forecast, or a downward revision to the number. The appropriate response depends on whether the gap comes from volume, quality, or timing. This week, revenue operations teams should audit the win rate assumption in their current coverage target, recalculate it from qualified opportunities, and establish that weekly review cadence. Each review should end with action on the gap while there is still time to respond.
Methodology & sources
- Guide to Pipeline Coverage Ratios That Actually Drive Growth - Fullcast
Supplied the coverage formula, the stage-weighting and timing adjustments, segment differences, and the point about high-ICP accounts being a minority of pipeline.
- The coverage delusion: why 3x pipeline coverage keeps missing the number
Informed the argument that 3x coverage has no empirical basis, that falling win rates raise the required multiple, and that high nominal coverage can hide risk.